Gait Lab Analysis
Walking Data for the Class:
https://docs.google.com/spreadsheets/d/150b1-yV3A_sxjVM_x5nBJOxQmjUJ6iwnHH4JuQfsgto/edit#gid=1928711889
https://docs.google.com/spreadsheets/d/11Vi-5BI6Pan_hd_4M3LkNB4F98hUP6svYFpqDxExO_E/edit#gid=0
https://docs.google.com/spreadsheets/d/150b1-yV3A_sxjVM_x5nBJOxQmjUJ6iwnHH4JuQfsgto/edit#gid=1928711889
https://docs.google.com/spreadsheets/d/11Vi-5BI6Pan_hd_4M3LkNB4F98hUP6svYFpqDxExO_E/edit#gid=0
Comparing Class Data:
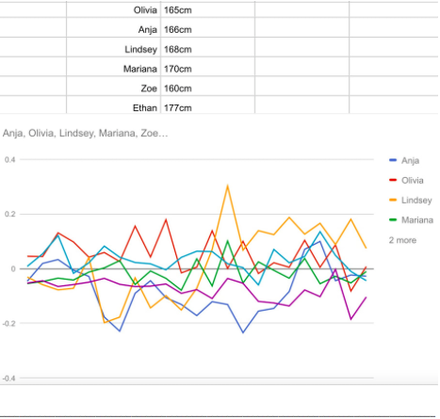
To compare each others data, we all learned how to put it on a google spread sheet, and with all of this information we were then able to make a model in order to be able to predict someones height by just looking at their data. We then put the x data from six different groups on one spreadsheet and graphed it. We observed what each groups data looked like charted and compared it to their height. The less amount of bumps someone had in the line created from graphing their data, the less amount of steps they take and the taller they are.
To compare each others data, we all learned how to put it on a google spread sheet, and with all of this information we were then able to make a model in order to be able to predict someones height by just looking at their data. We then put the x data from six different groups on one spreadsheet and graphed it. We observed what each groups data looked like charted and compared it to their height. The less amount of bumps someone had in the line created from graphing their data, the less amount of steps they take and the taller they are.
Using a Predictive Model to Determine and Unknown Height:
When someone's data shows that they take less steps, we can assume that they are taller, and when the data shows more steps, we can assume that their leg length is shorter due to the need to take more steps resulting in a shorter person. Every sharp bump in the graph shows a step, so then when the graphs are on top of each other you can easily see who took more steps.
When someone's data shows that they take less steps, we can assume that they are taller, and when the data shows more steps, we can assume that their leg length is shorter due to the need to take more steps resulting in a shorter person. Every sharp bump in the graph shows a step, so then when the graphs are on top of each other you can easily see who took more steps.
Class Data Chart:
Walking Data for our Group:
https://docs.google.com/spreadsheets/d/1bZeO3HxX-Z5jPCBf_TKS6Yd7m1o54X6lDWiEWw2Kv6U/edit#gid=0
https://docs.google.com/spreadsheets/d/1bZeO3HxX-Z5jPCBf_TKS6Yd7m1o54X6lDWiEWw2Kv6U/edit#gid=0
How We Collected Our Data:
We all downloaded an app on our phones called Accelerometer, which would calculate while we were walking. We decided to use Anja as our person to analyze, so we measured her height, leg length, and how long it took her to walk a certain distance. We also decided to put the phone right on her stomach so it would her measure her walking straight from her center of gravity. We did three different trials and then emailed ourselves the results so we could put them on a google spreadsheet to analyze it.
We all downloaded an app on our phones called Accelerometer, which would calculate while we were walking. We decided to use Anja as our person to analyze, so we measured her height, leg length, and how long it took her to walk a certain distance. We also decided to put the phone right on her stomach so it would her measure her walking straight from her center of gravity. We did three different trials and then emailed ourselves the results so we could put them on a google spreadsheet to analyze it.
Reflection:
This lab was somewhat confusing in the beginning because we were trying to figure out what it was exactly that we were trying to measure. Also some of our data probably turned out inaccurate because Anja had to hold the phone on her stomach and her hand probably moved slightly during each trial skewing the data from what it would actually be, and also the second it took to press the start button then bring the phone up to her stomach would add more skewed data to our trials.
Our group worked well together and we all put work in but we all had to work together to put the data on a spreadsheet which was difficult and we then ended up collaborating with other groups so we then all figured it out together.
It was very important that we understood what our data was saying and that it was correct, even though ours was probably slightly skewed it still gave us a good idea on how to use it as a predictive model.
If we were to do it again and design a better, more accurate experiment, I would figure out how to attach the phone better to our test subject so there would be no inaccuracies. We also should have collaborated with our classmates before the experiment so we all could have decided on the same distance or same number of steps. It also would have been interesting to make more visuals to compare the data with different charts and graphs and maybe isolated the different parts more with more visuals.
Vocab/Terms
Gait - a person's manner of walking
(what we were measuring)
Accelerometer - an instrument for measuring acceleration
(we downloaded an accelerometer app and used it to to measures one's acceleration)
Dynamicity - the quantification of variations in kinematic or kinetic parameters within a step.
Metric - A quantitative indicator of a characteristic or attribute
Symmetry - In terms of gait analysis, the quantification of differences between left-foot and right-foot steps
Variability - In terms of gait analysis, the quantification of fluctuations from one stride to the next
The X, Y, and Z axis are forms of acceleration.
